
10 Year Land Subsidence Report
Ten years of your land's history. In one report. From space.
Land movement is often invisible until it's expensive - cracked foundations, a declined insurance claim, a stalled sale, or a price renegotiated after you've already committed. A LandSure report shows you what the ground has actually done for the past decade, so you find out before you buy, build, insure or sell - not after.
Why order a report
One report can save you from a very expensive mistake.
Land movement problems rarely show up on a standard building report or a drive-by. By the time they are visible, they are expensive. Here is what a LandSure report actually does for you.
Negotiate from a position of knowledge
Buying a property? Use the report to negotiate price, request remediation, or walk away - before you are legally committed. Selling? A clean history report reassures buyers and can help you avoid a last-minute price drop.
Avoid a five or six-figure surprise
Underpinning, retaining walls and slope remediation routinely cost tens of thousands of dollars once movement is visible in a property. A report from $345 flags the same movement years earlier, while it still costs nothing to act on.
Protect your resale value and cover
Undisclosed ground movement is a liability at your next sale, and can complicate insurance claims down the line. A documented, dated history protects your position either way.
Please read before you buy. LandSure is not a geotechnical engineer, and this report is not analysis, certification or a professional opinion. Think of it as a canary in the coal mine - a satellite data report that flags where the ground may be moving. It is meant to be used alongside your local geotechnical engineer, who knows your area and the differences in the land. InSAR does not work equally well in all land types, so please check that this product is right for you before purchasing.
What does a LandSure report actually look like?
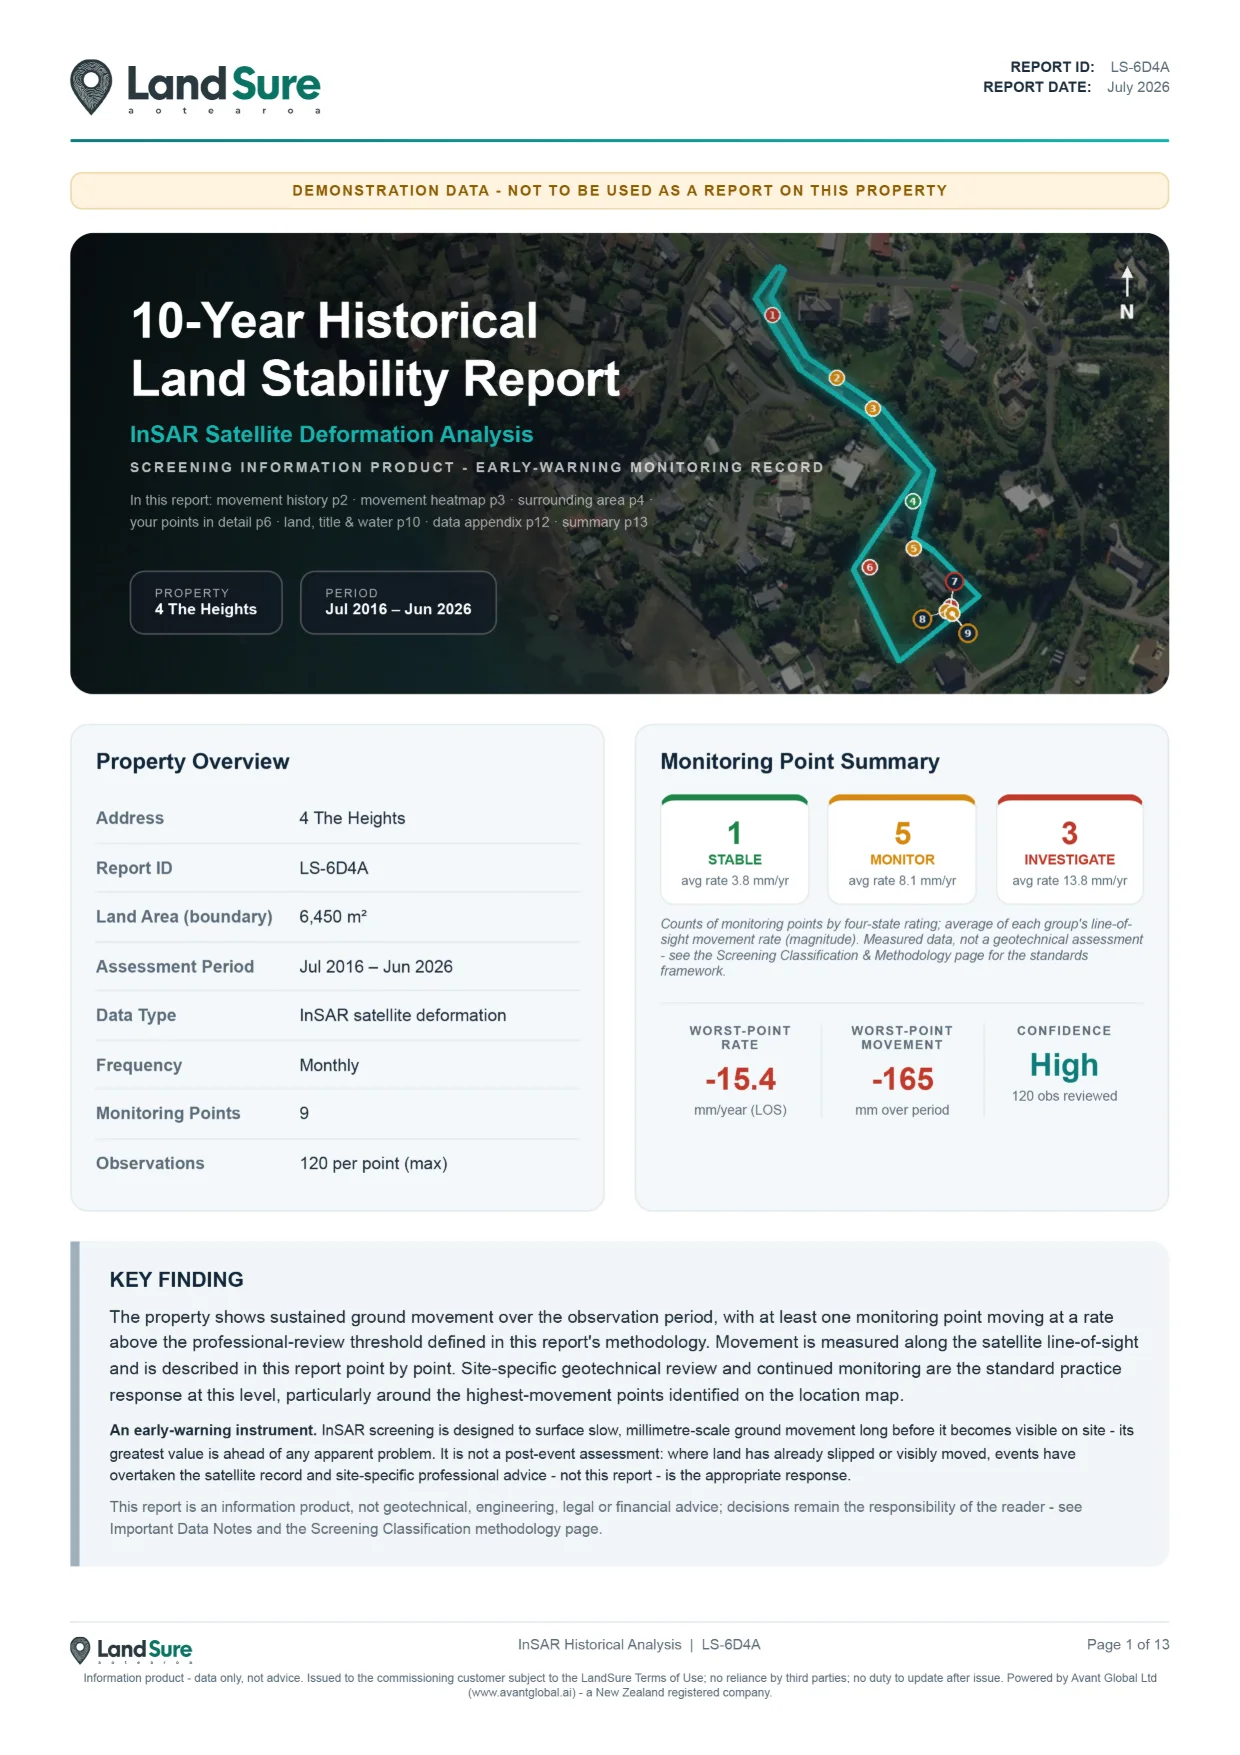
Real pages from a LandSure report on a demonstration property. Every report is a 13-page InSAR Historical Analysis, with a full data appendix listing each monitoring point and its measured velocity.
Page 1: Cover & property overview - monitoring-point ratings, worst-point rate and the plain-English key finding.
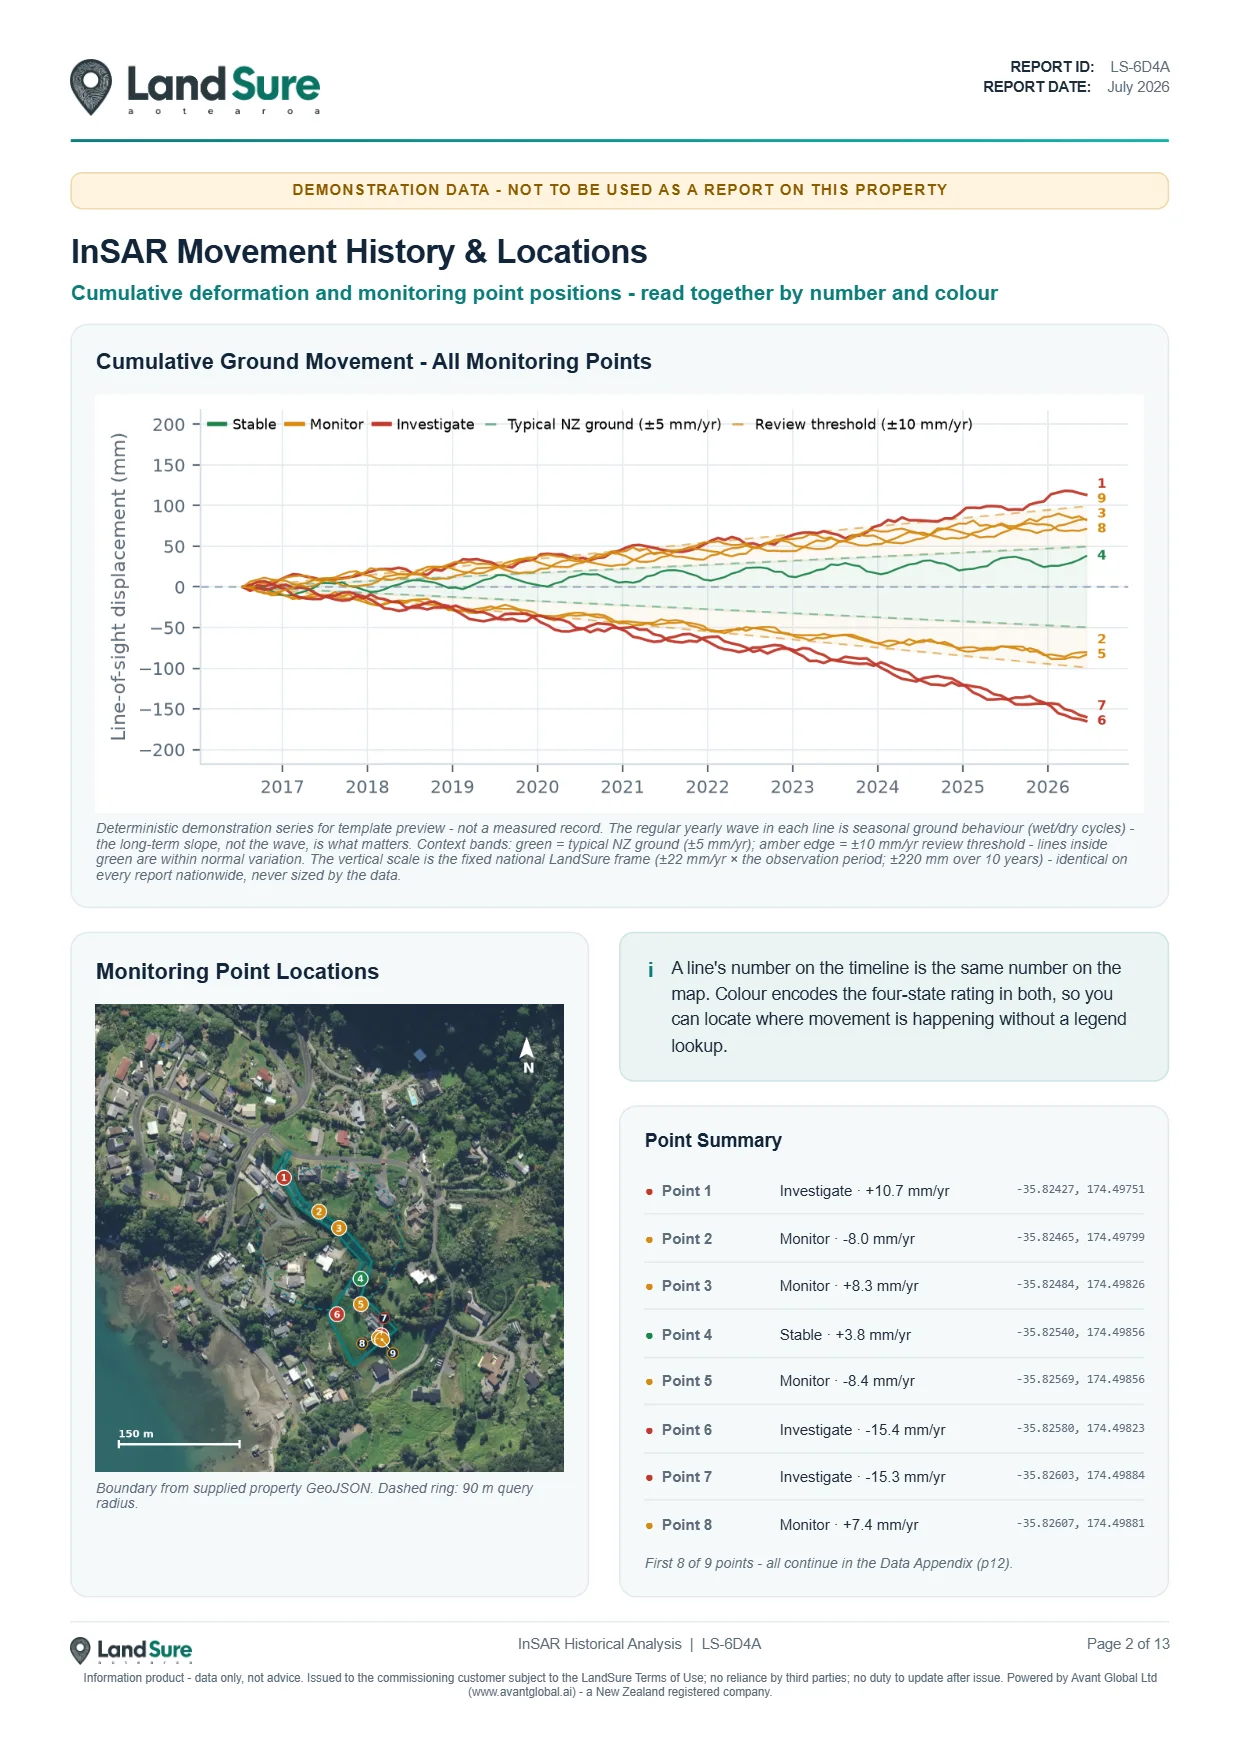
Page 2: InSAR movement history & locations - cumulative deformation with each point mapped by number and colour.
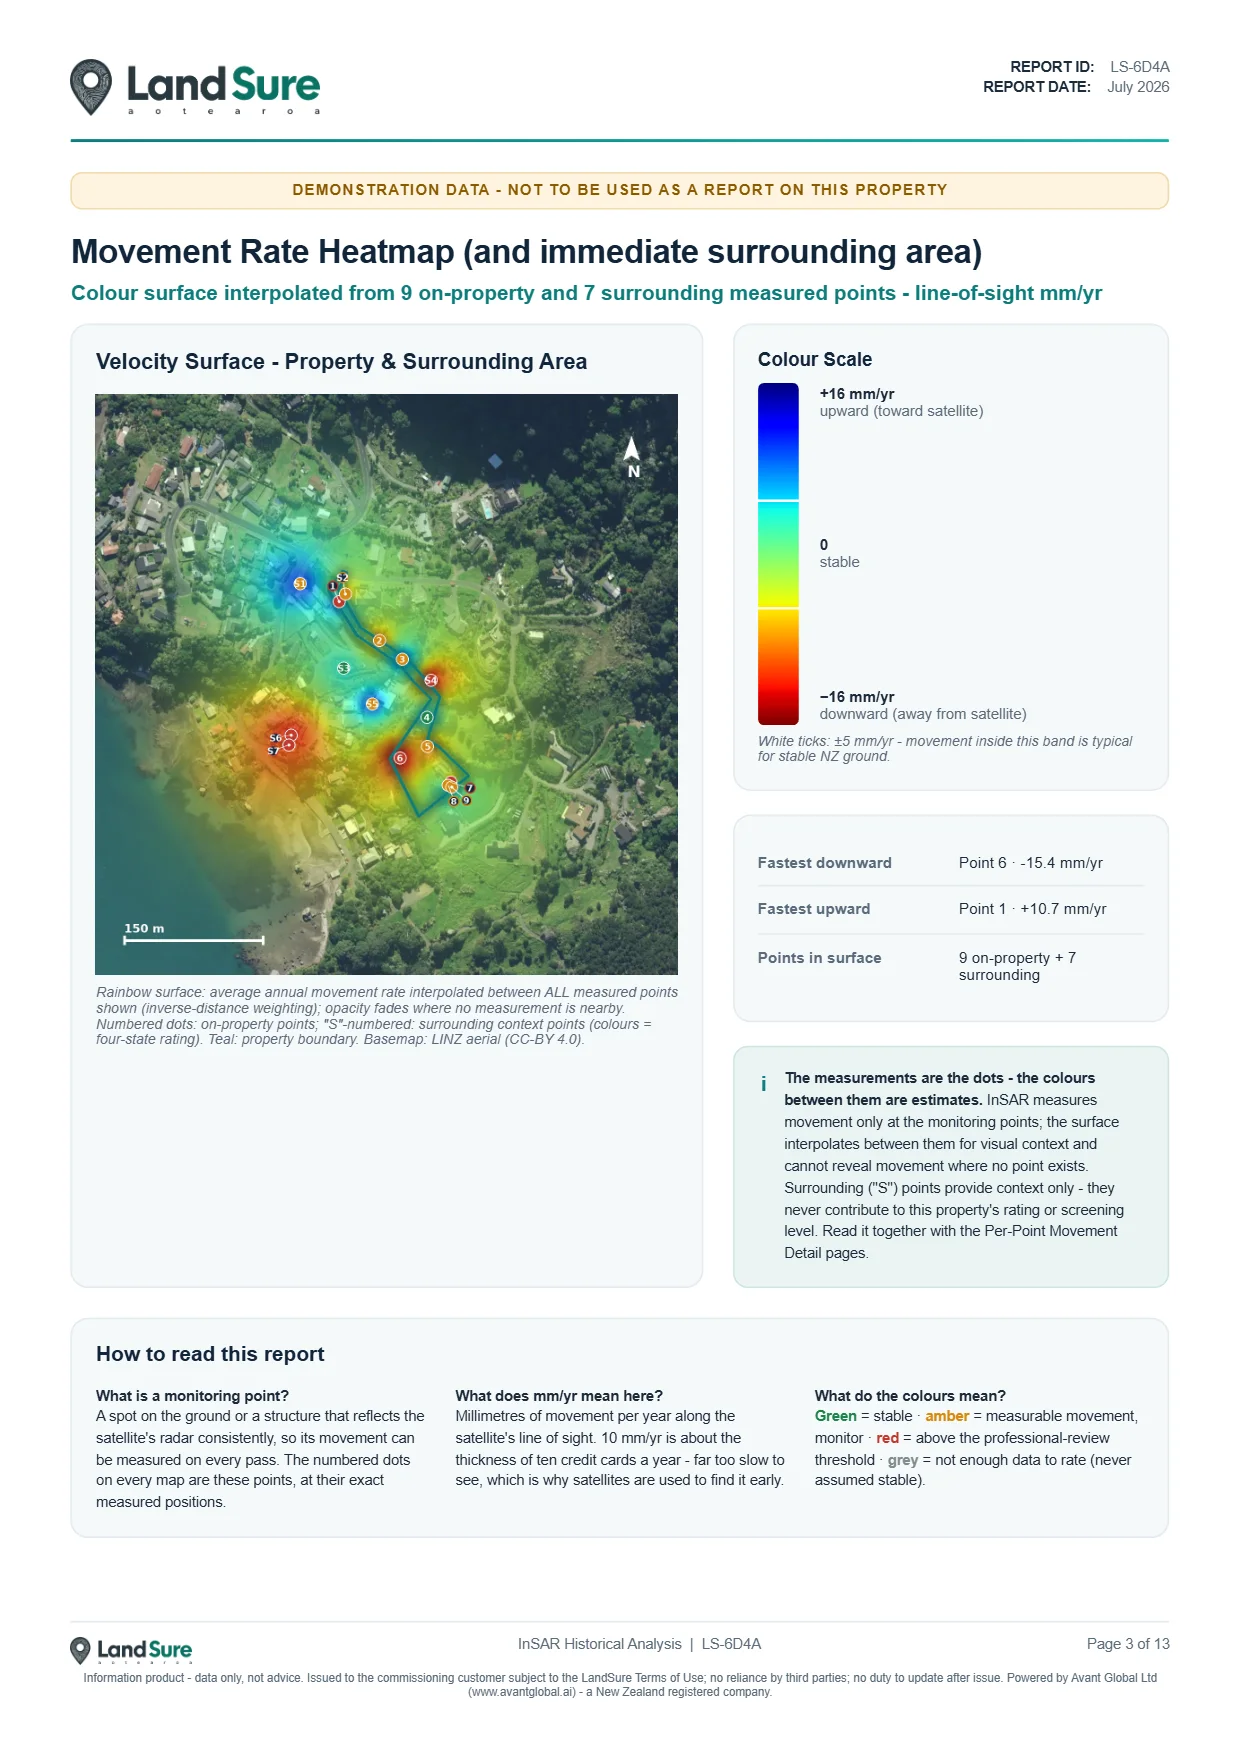
Page 3: Movement rate heatmap - an interpolated velocity surface across the property and immediate surrounds.
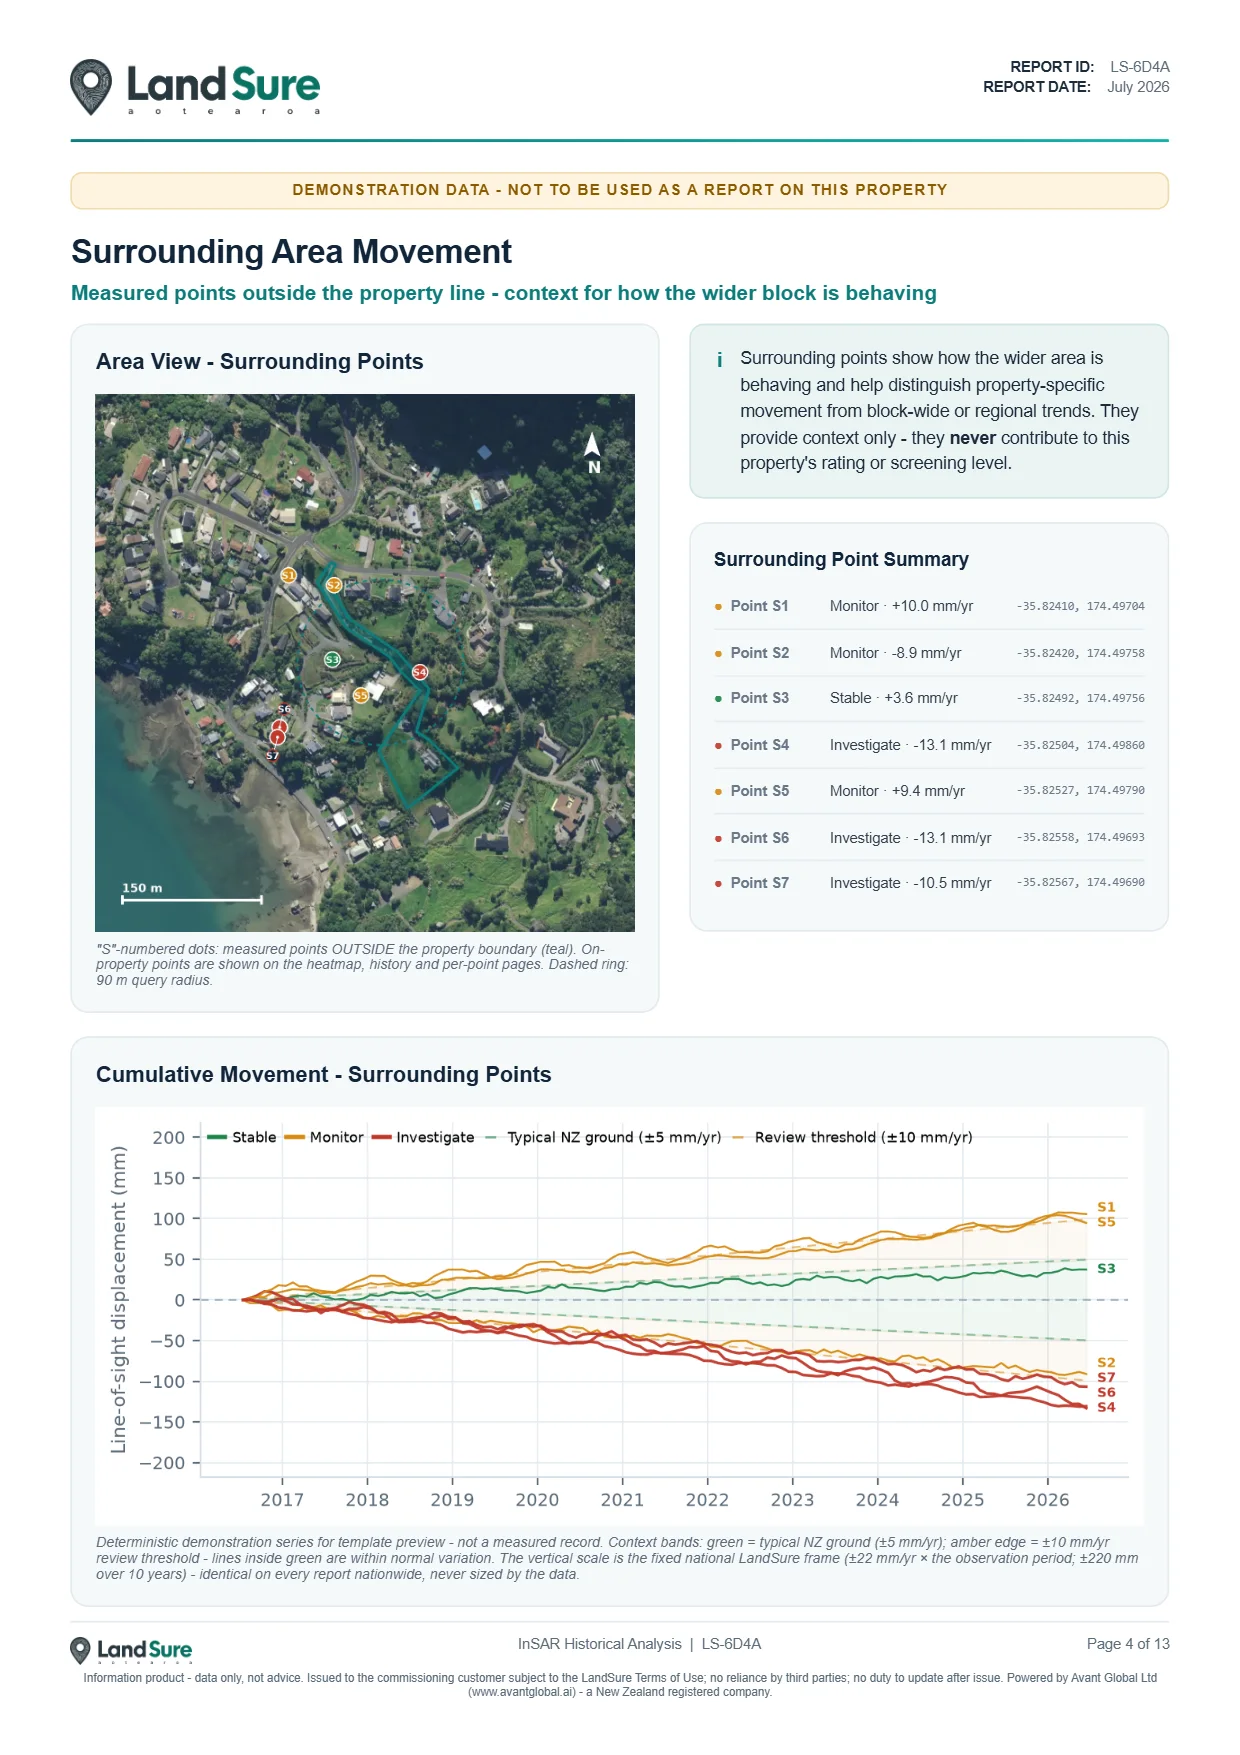
Page 4: Surrounding area movement - measured points outside the boundary, for context on the wider block.
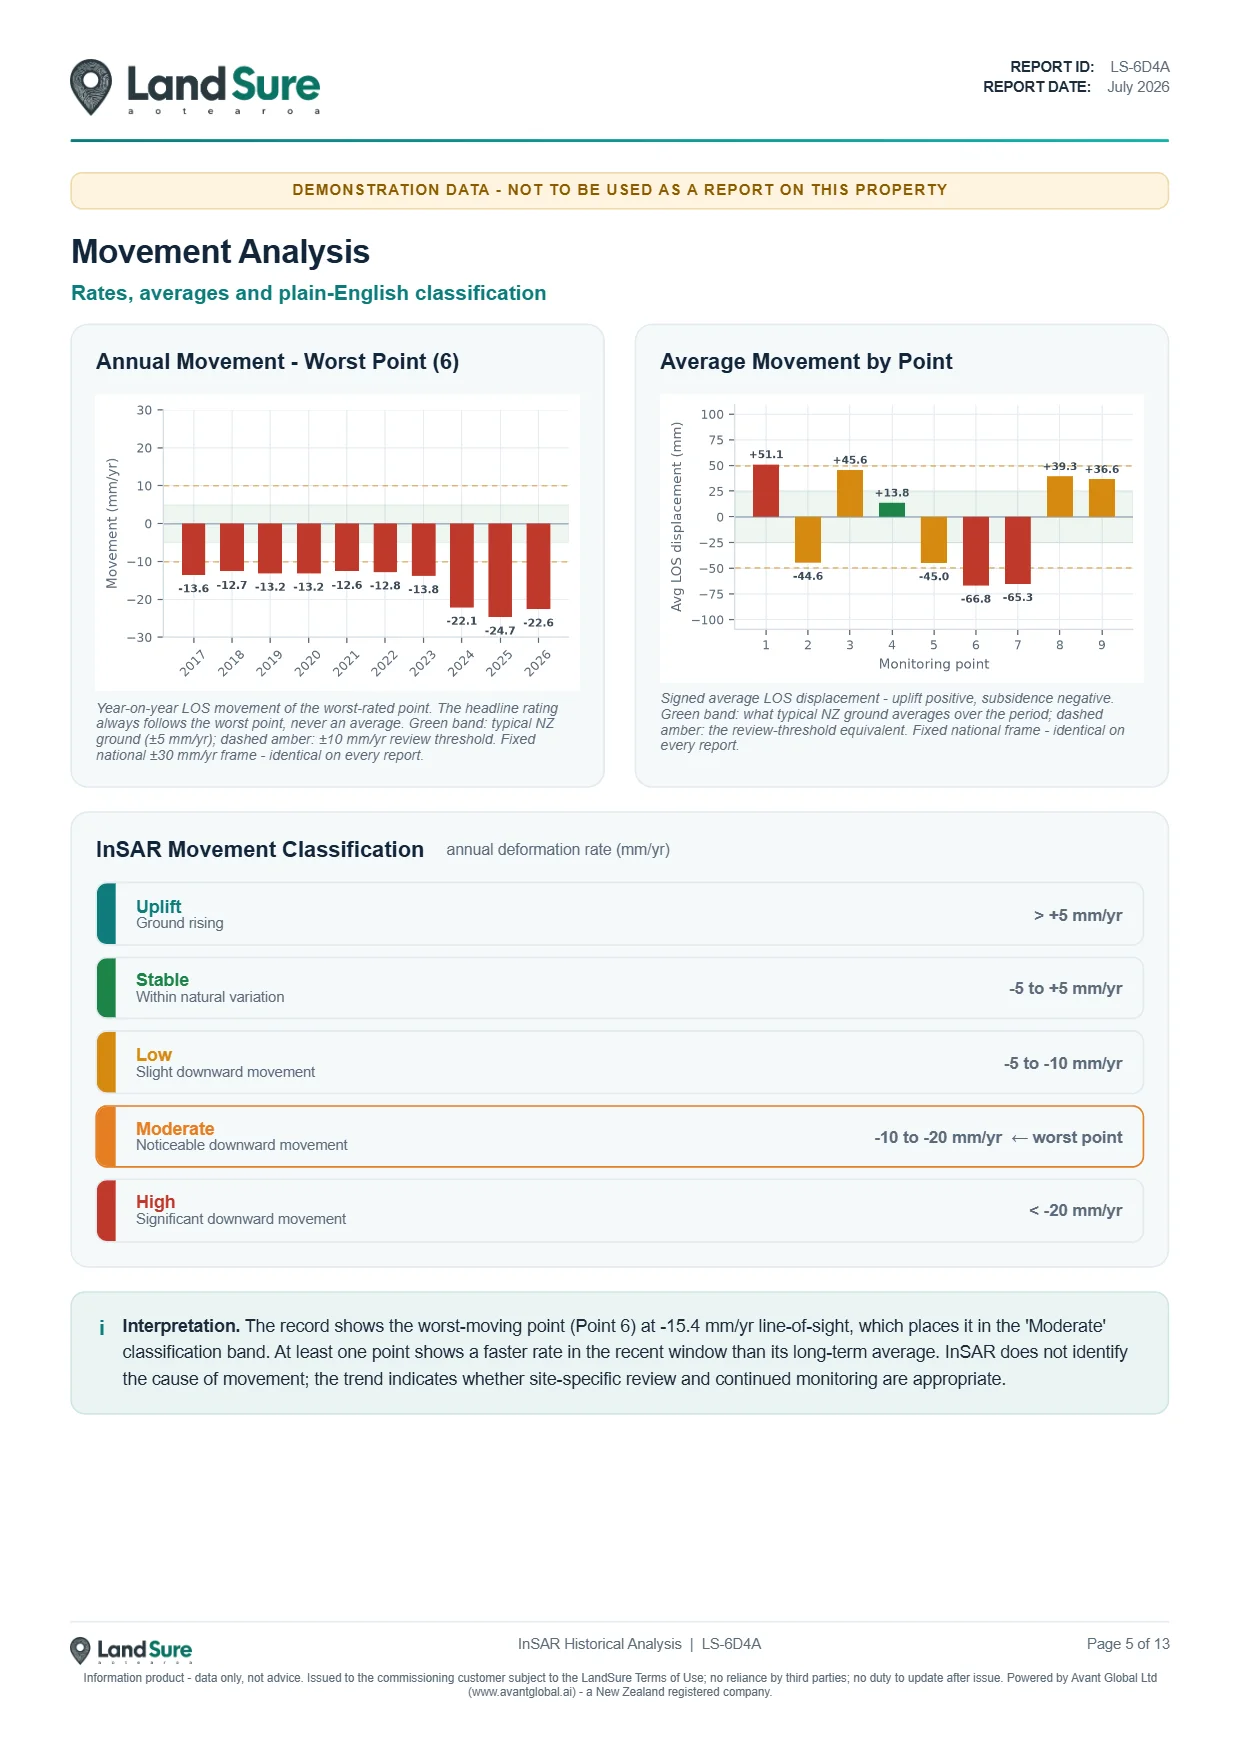
Page 5: Movement analysis - rates, averages and plain-English classification.
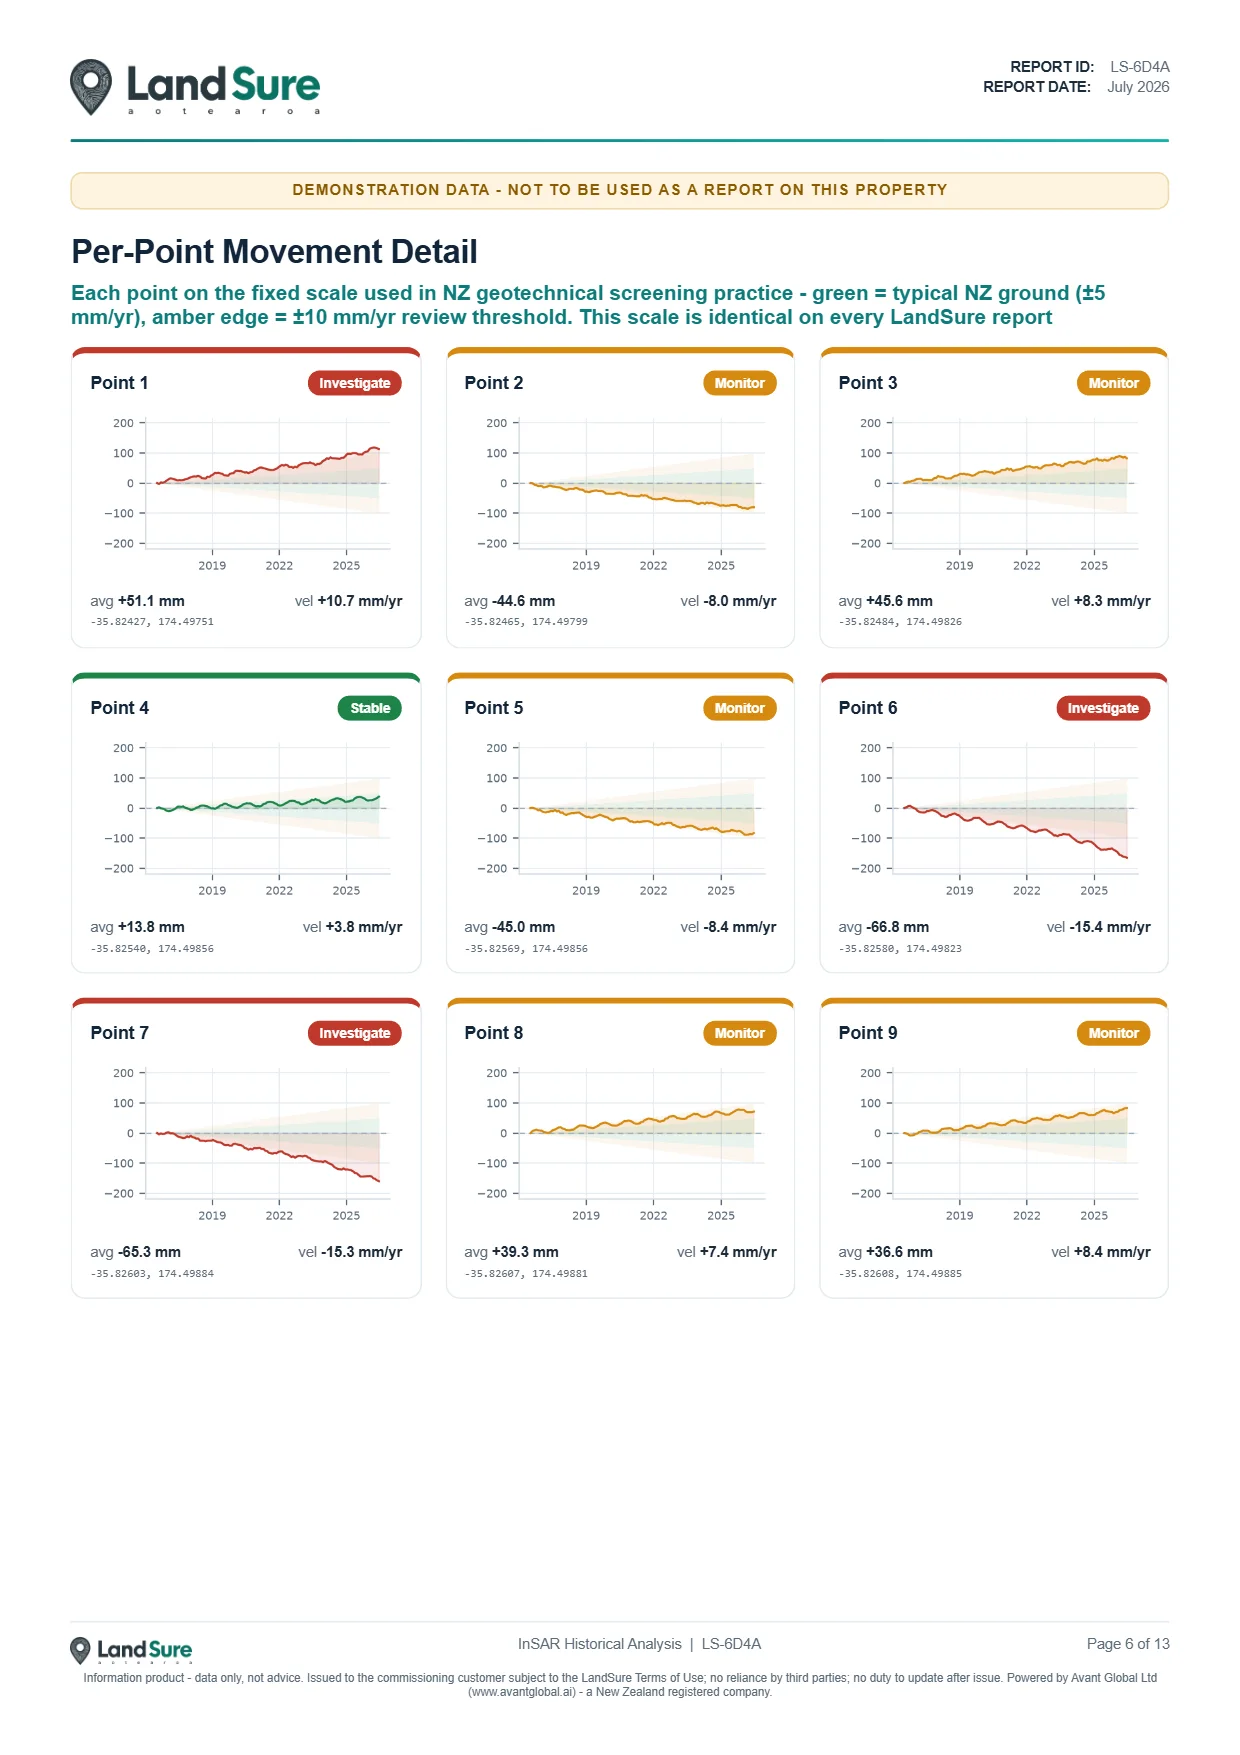
Page 6: Per-point movement detail - every point on the fixed national scale used in NZ screening practice.
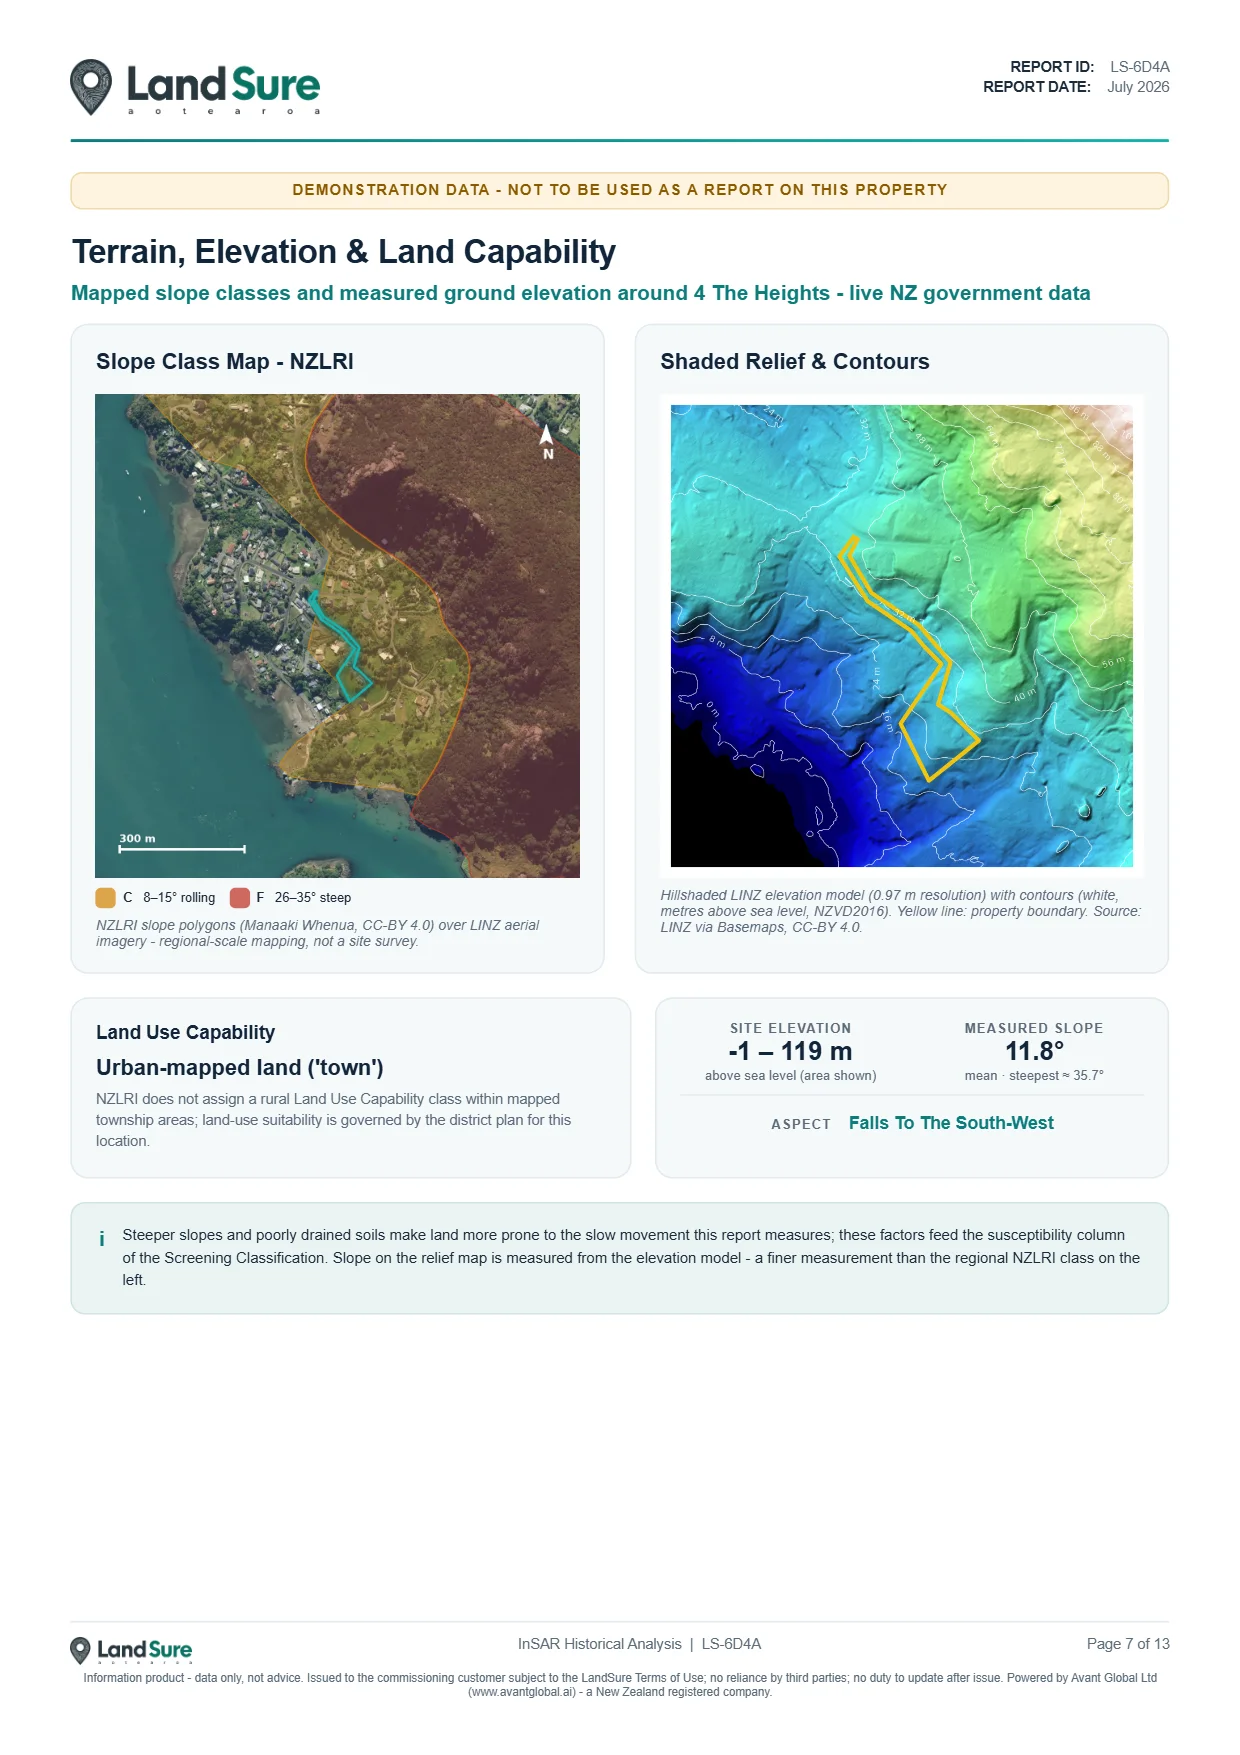
Page 7: Terrain, elevation & land capability - mapped slope classes and measured ground elevation.
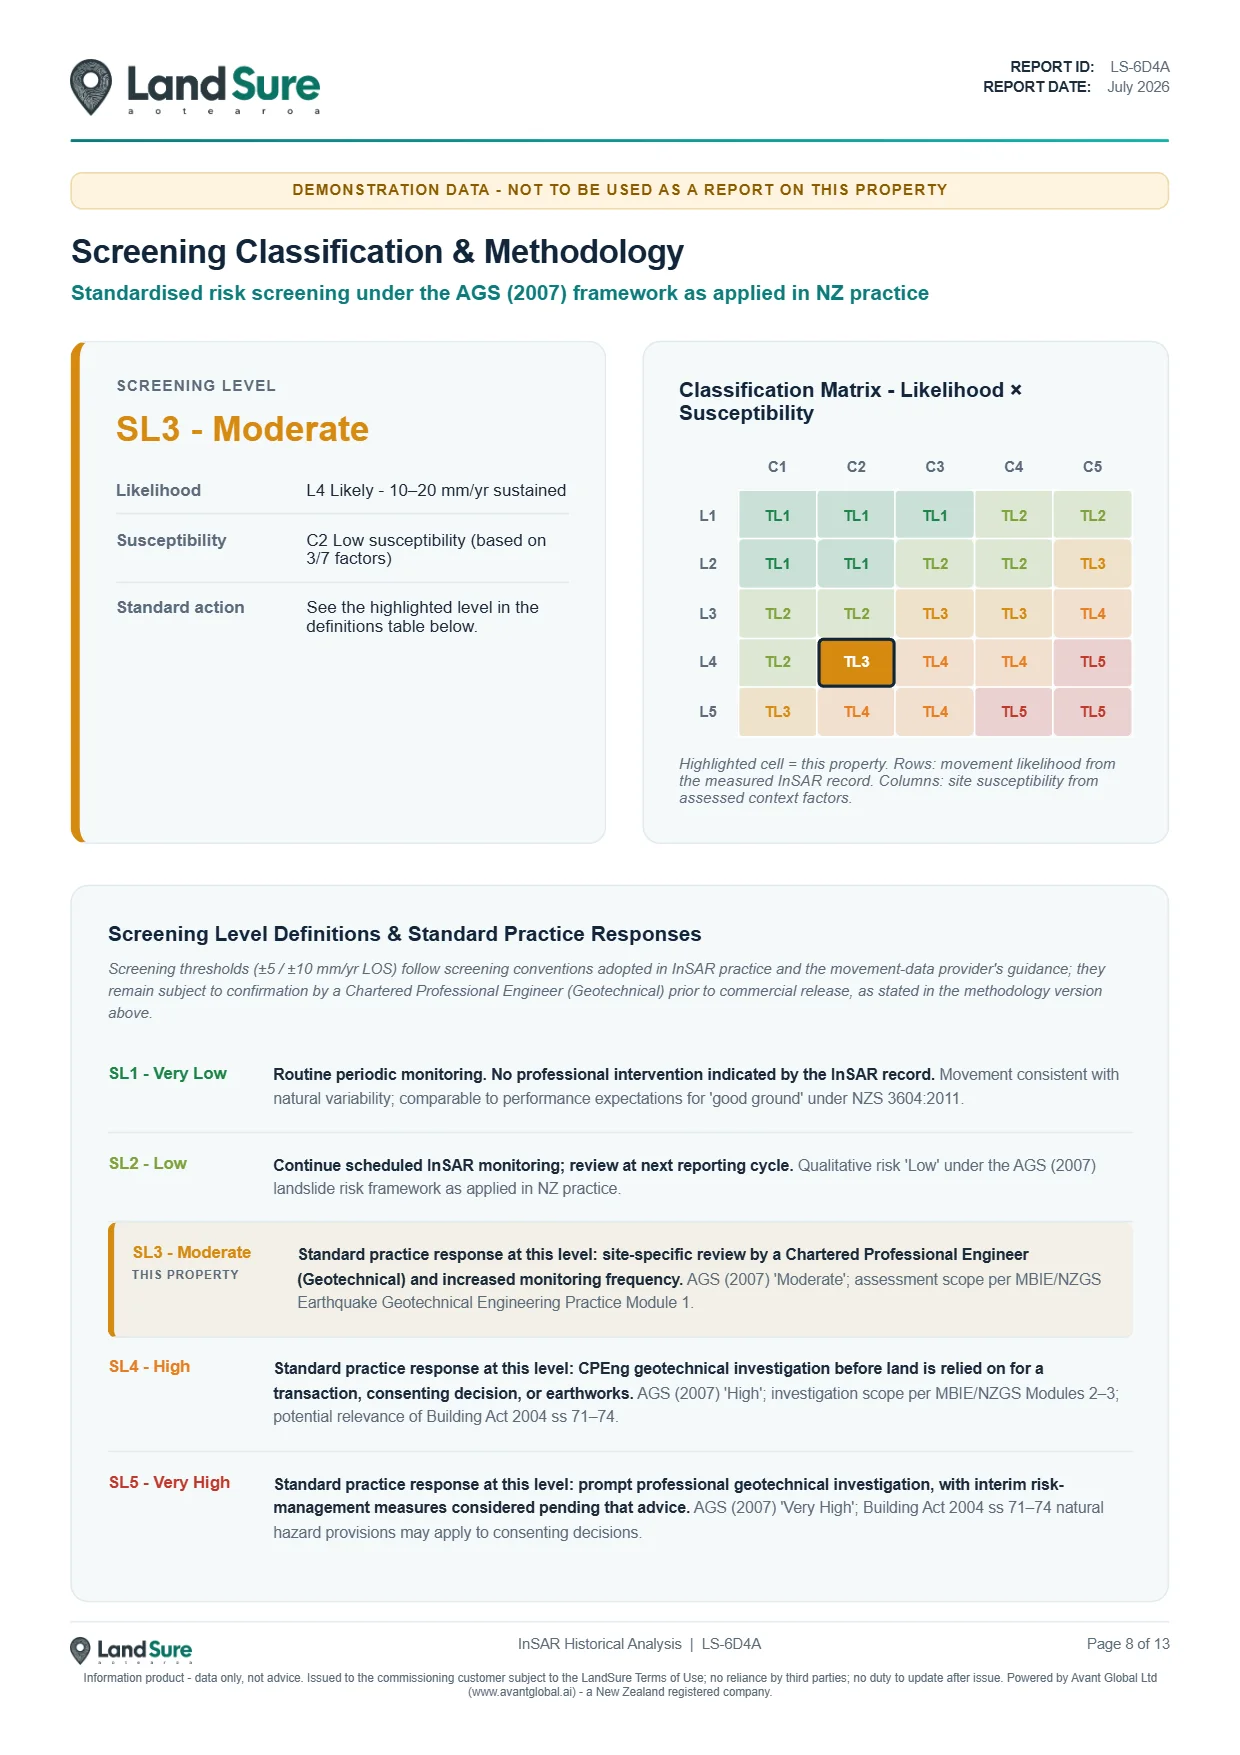
Page 8: Screening classification & methodology - standardised screening under the AGS (2007) framework.
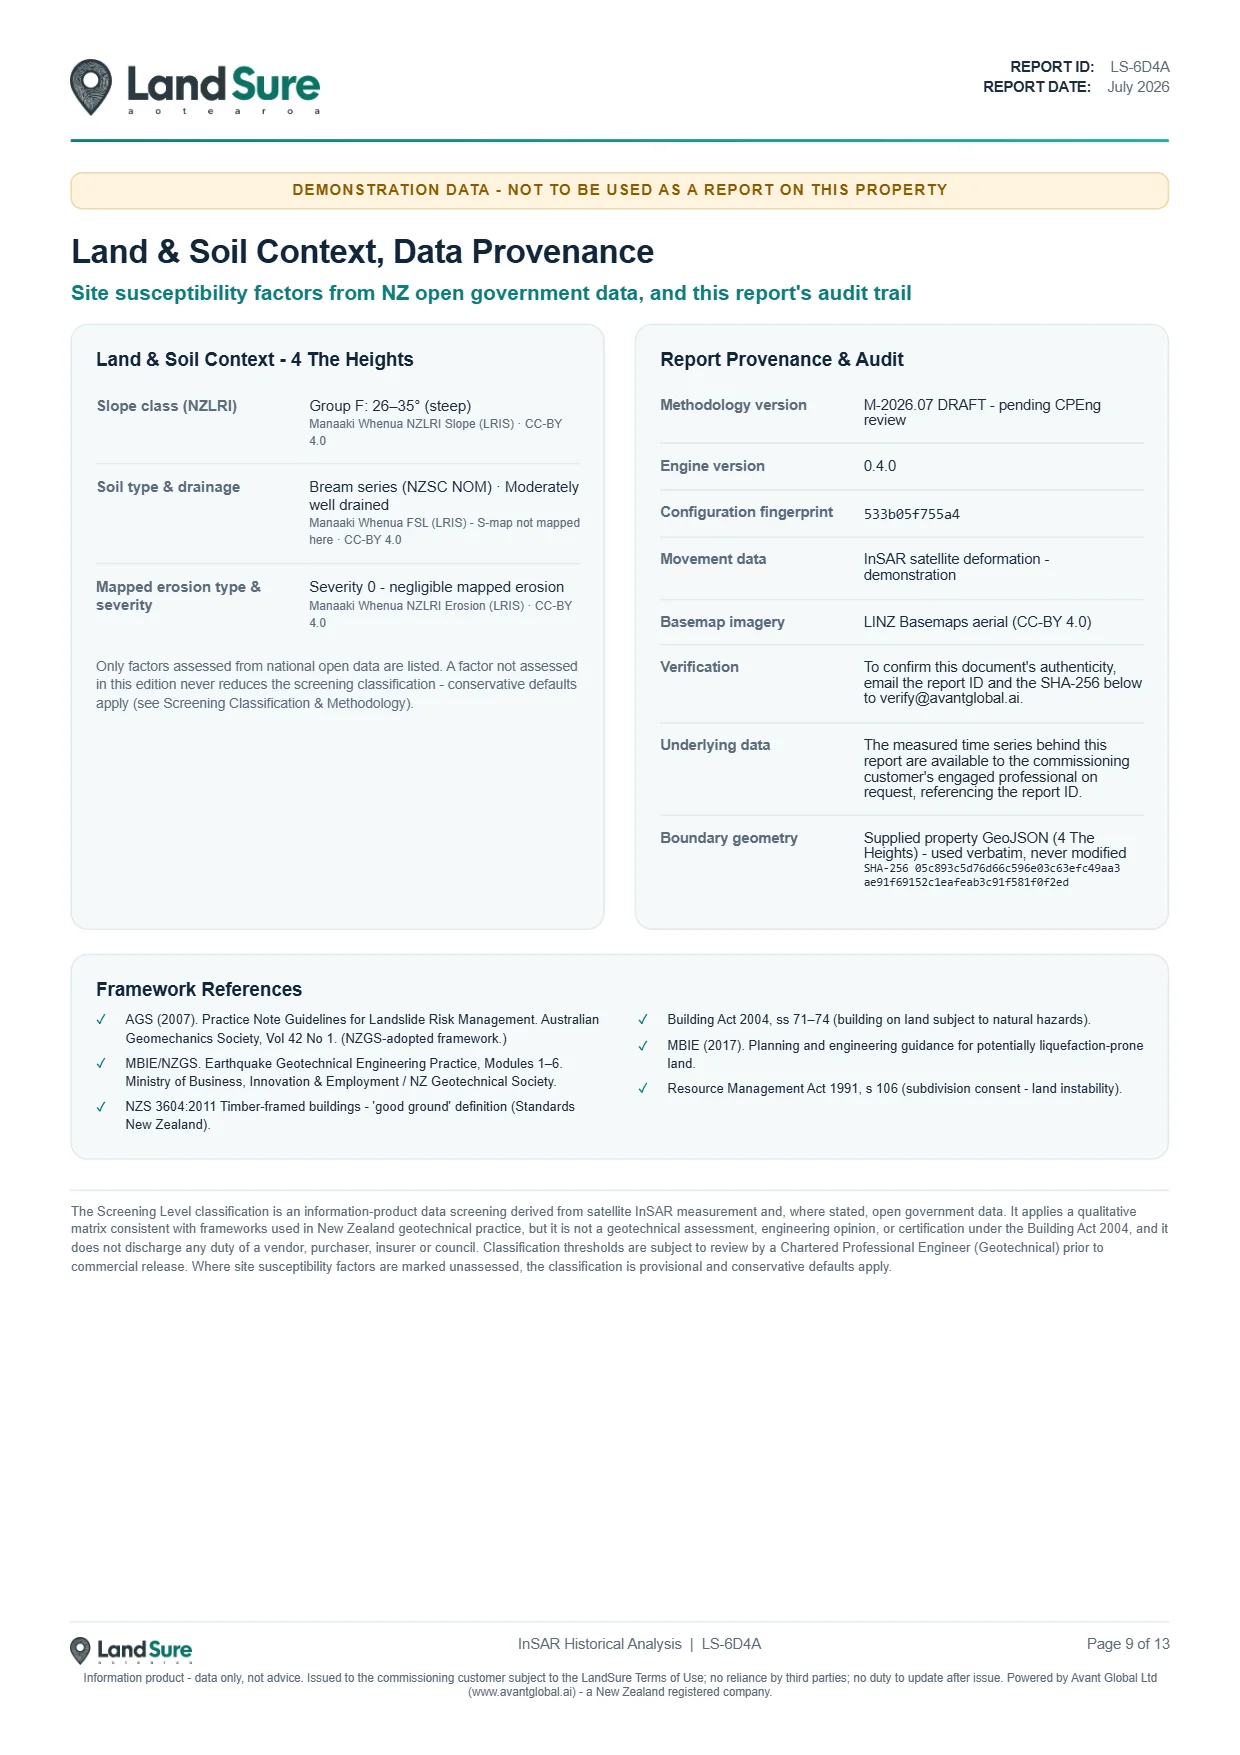
Page 9: Land & soil context and data provenance - site susceptibility factors and the audit trail.
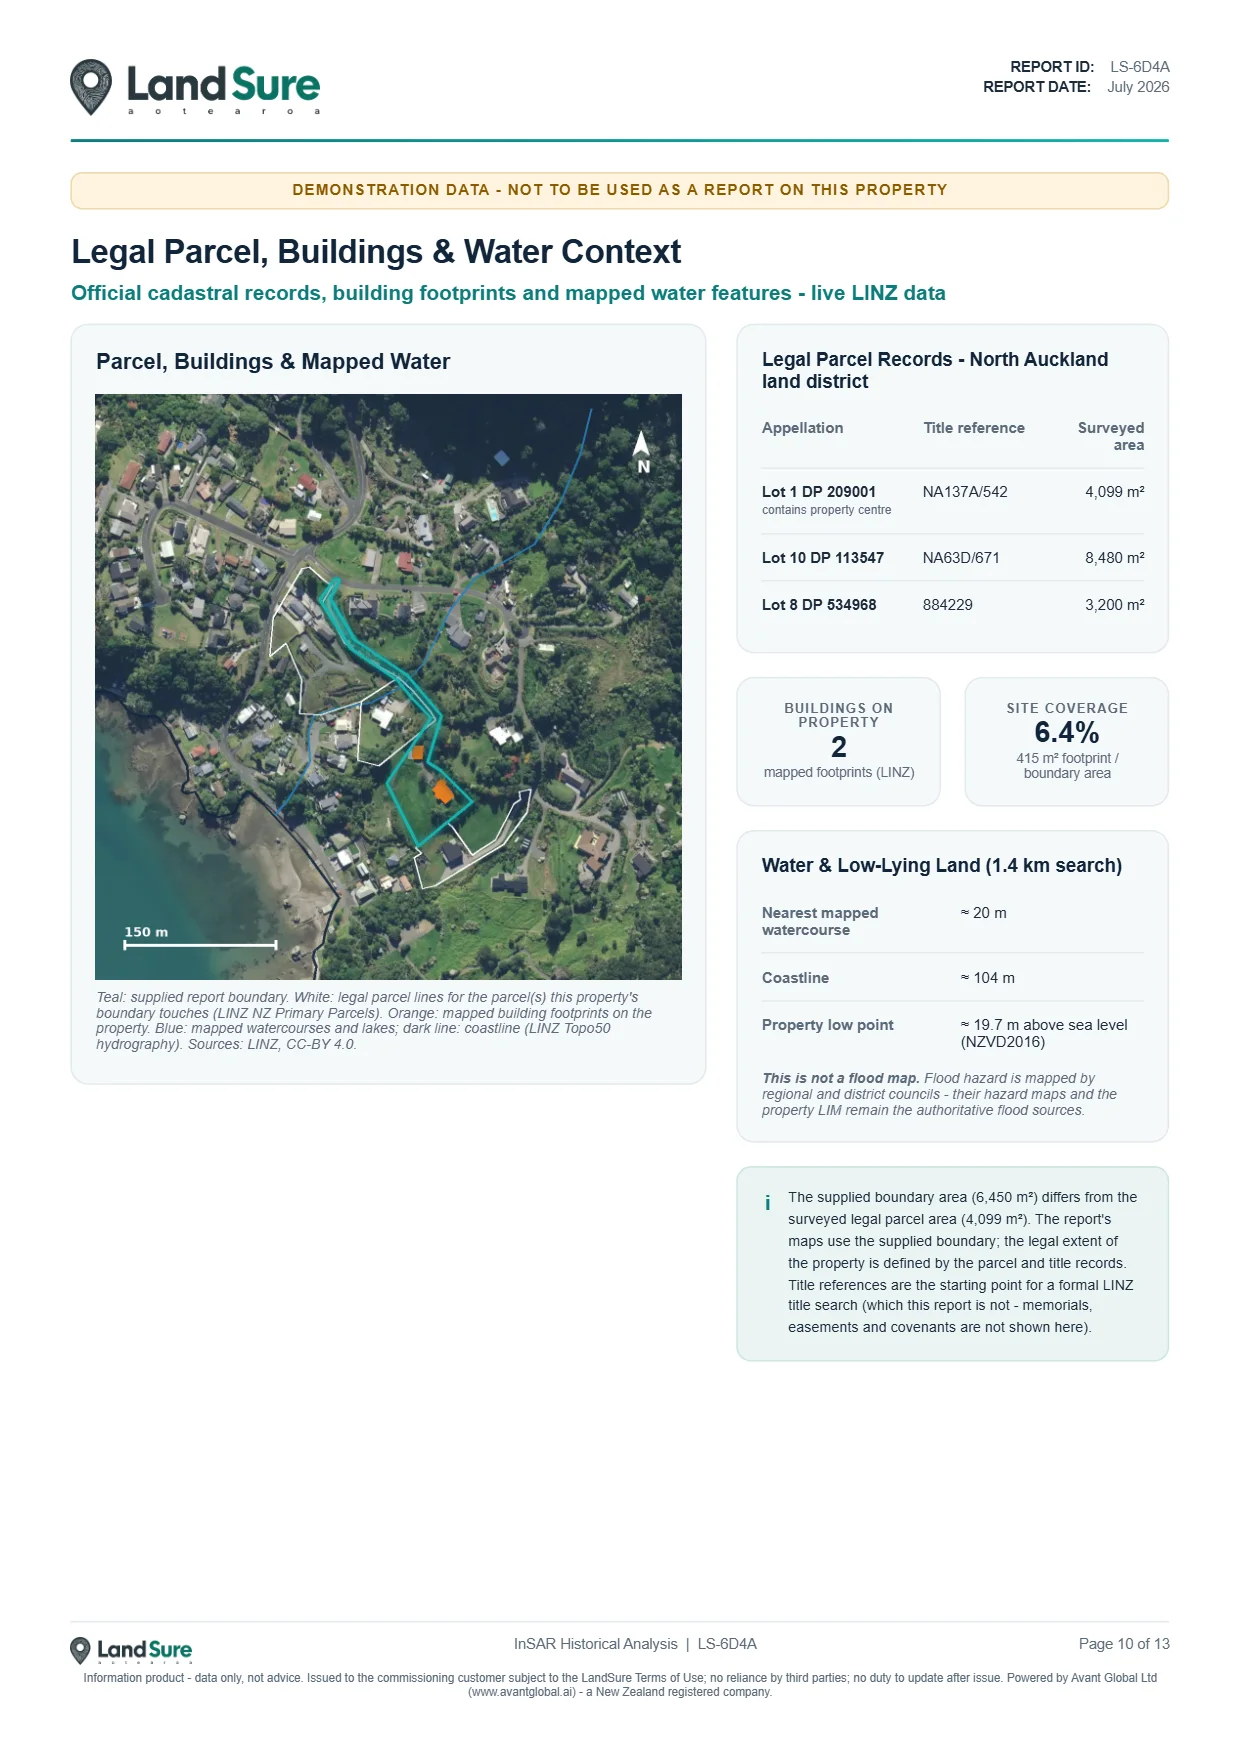
Page 10: Legal parcel, buildings & water context - cadastral records, building footprints and mapped water features.
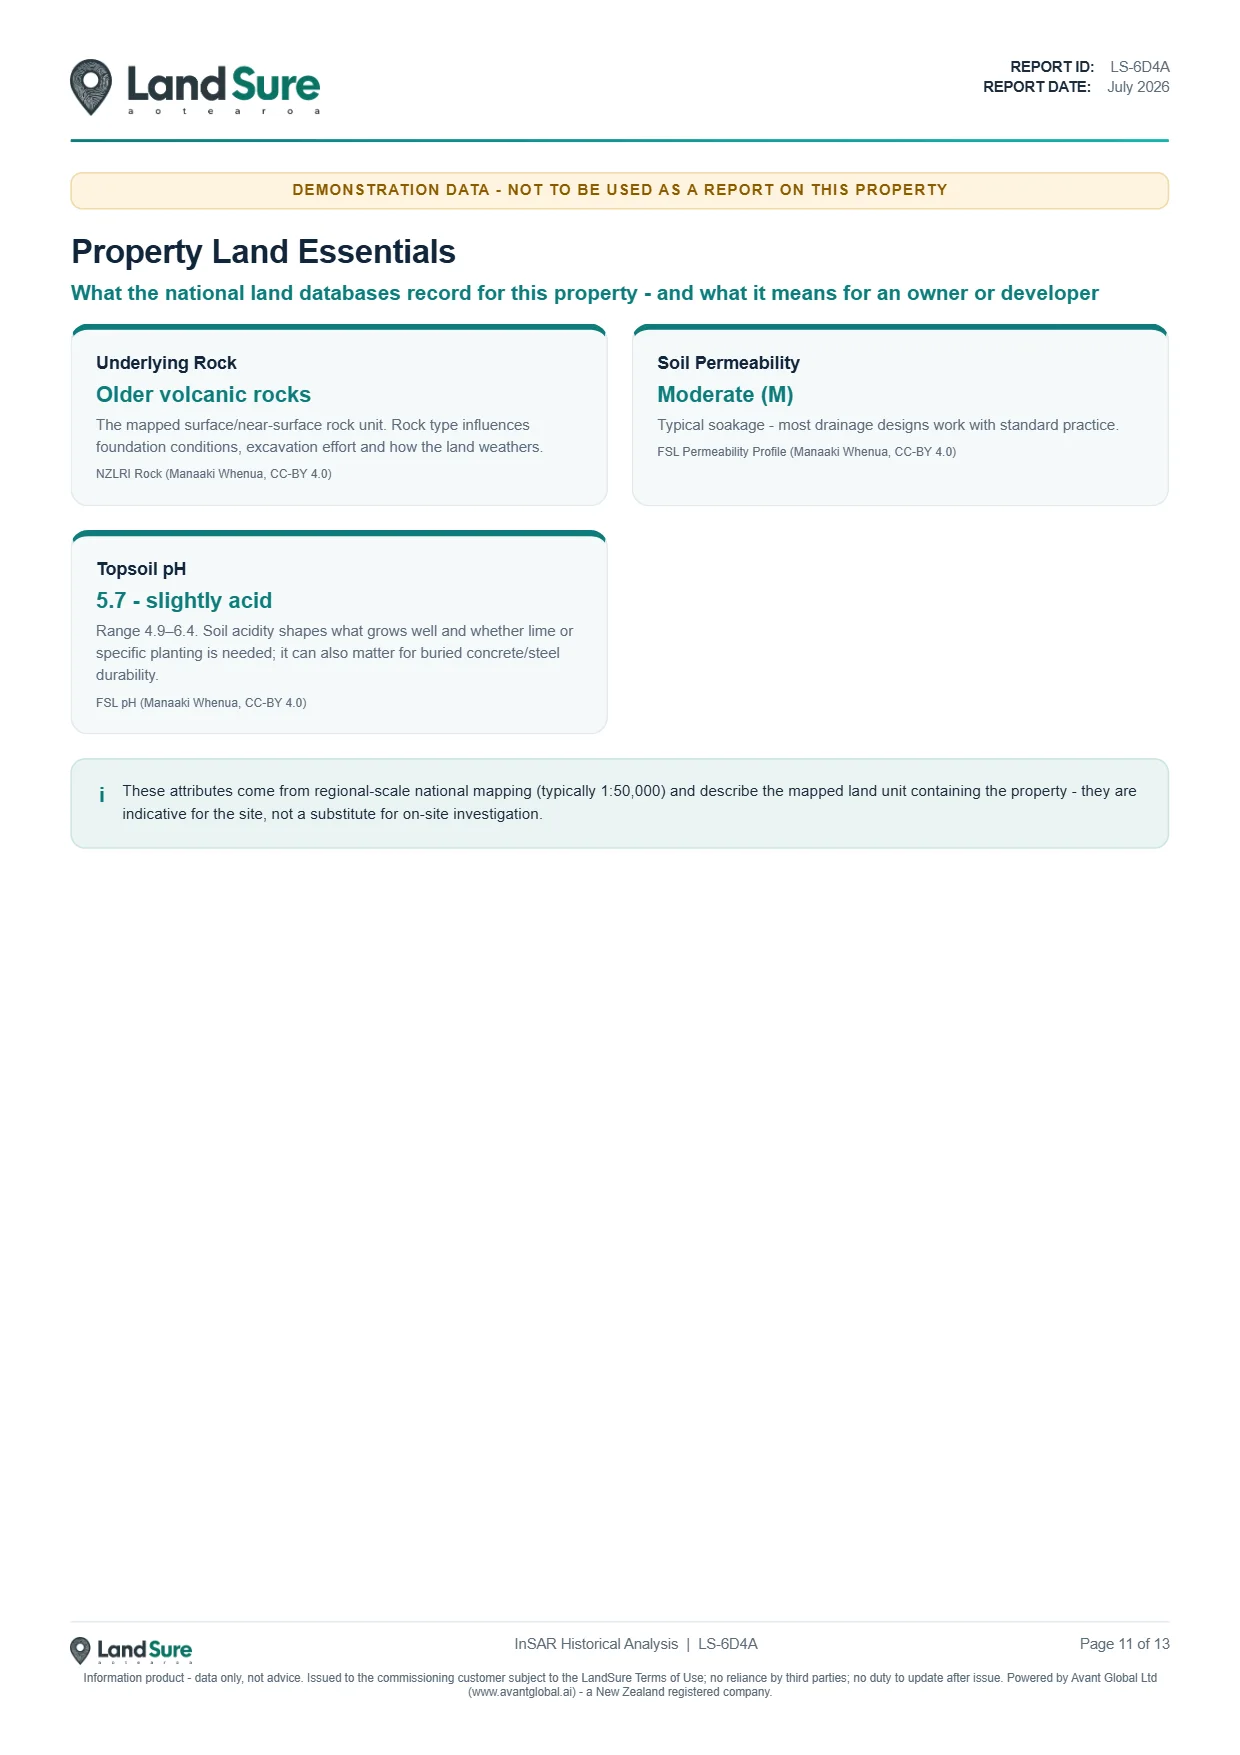
Page 11: Property land essentials - what the national land databases record for this property.
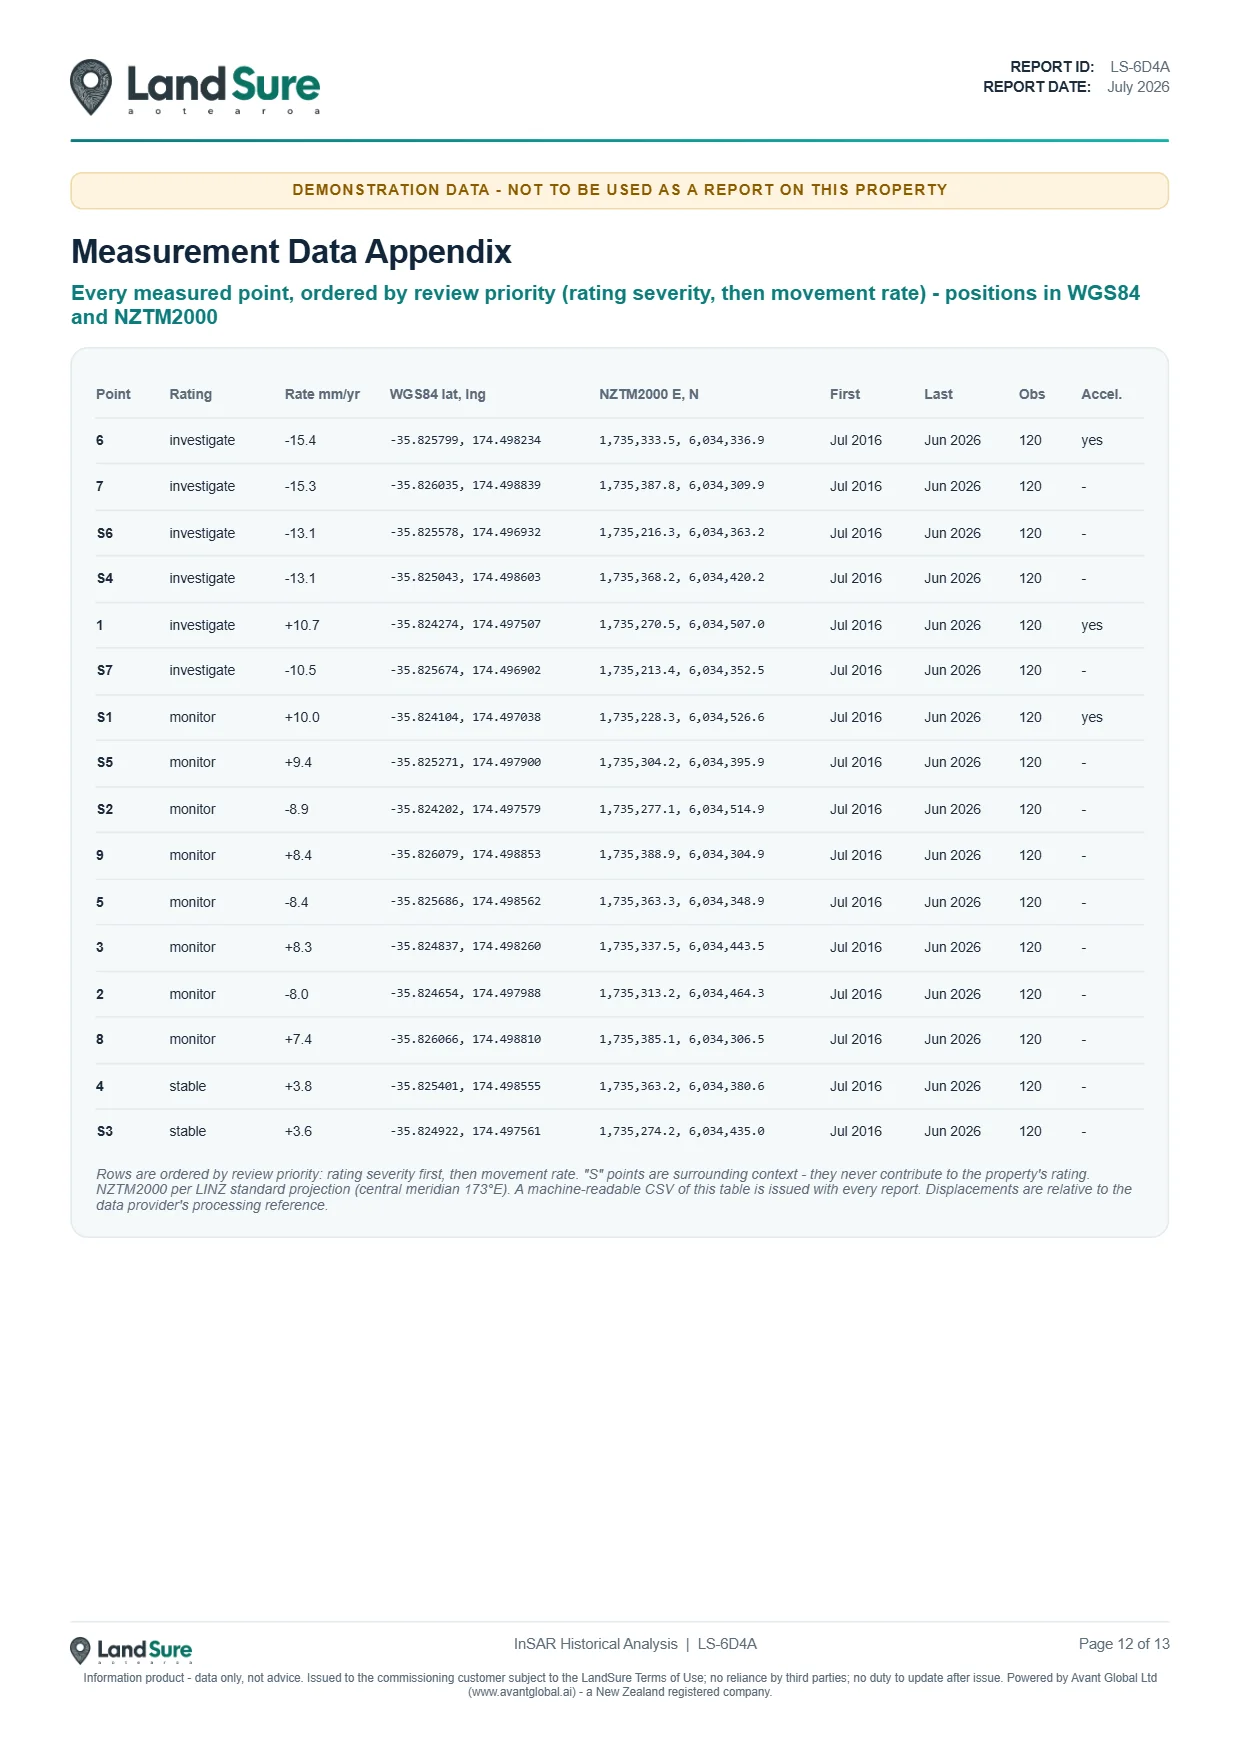
Page 12: Measurement data appendix - every measured point, ordered by review priority, positions in WGS84.
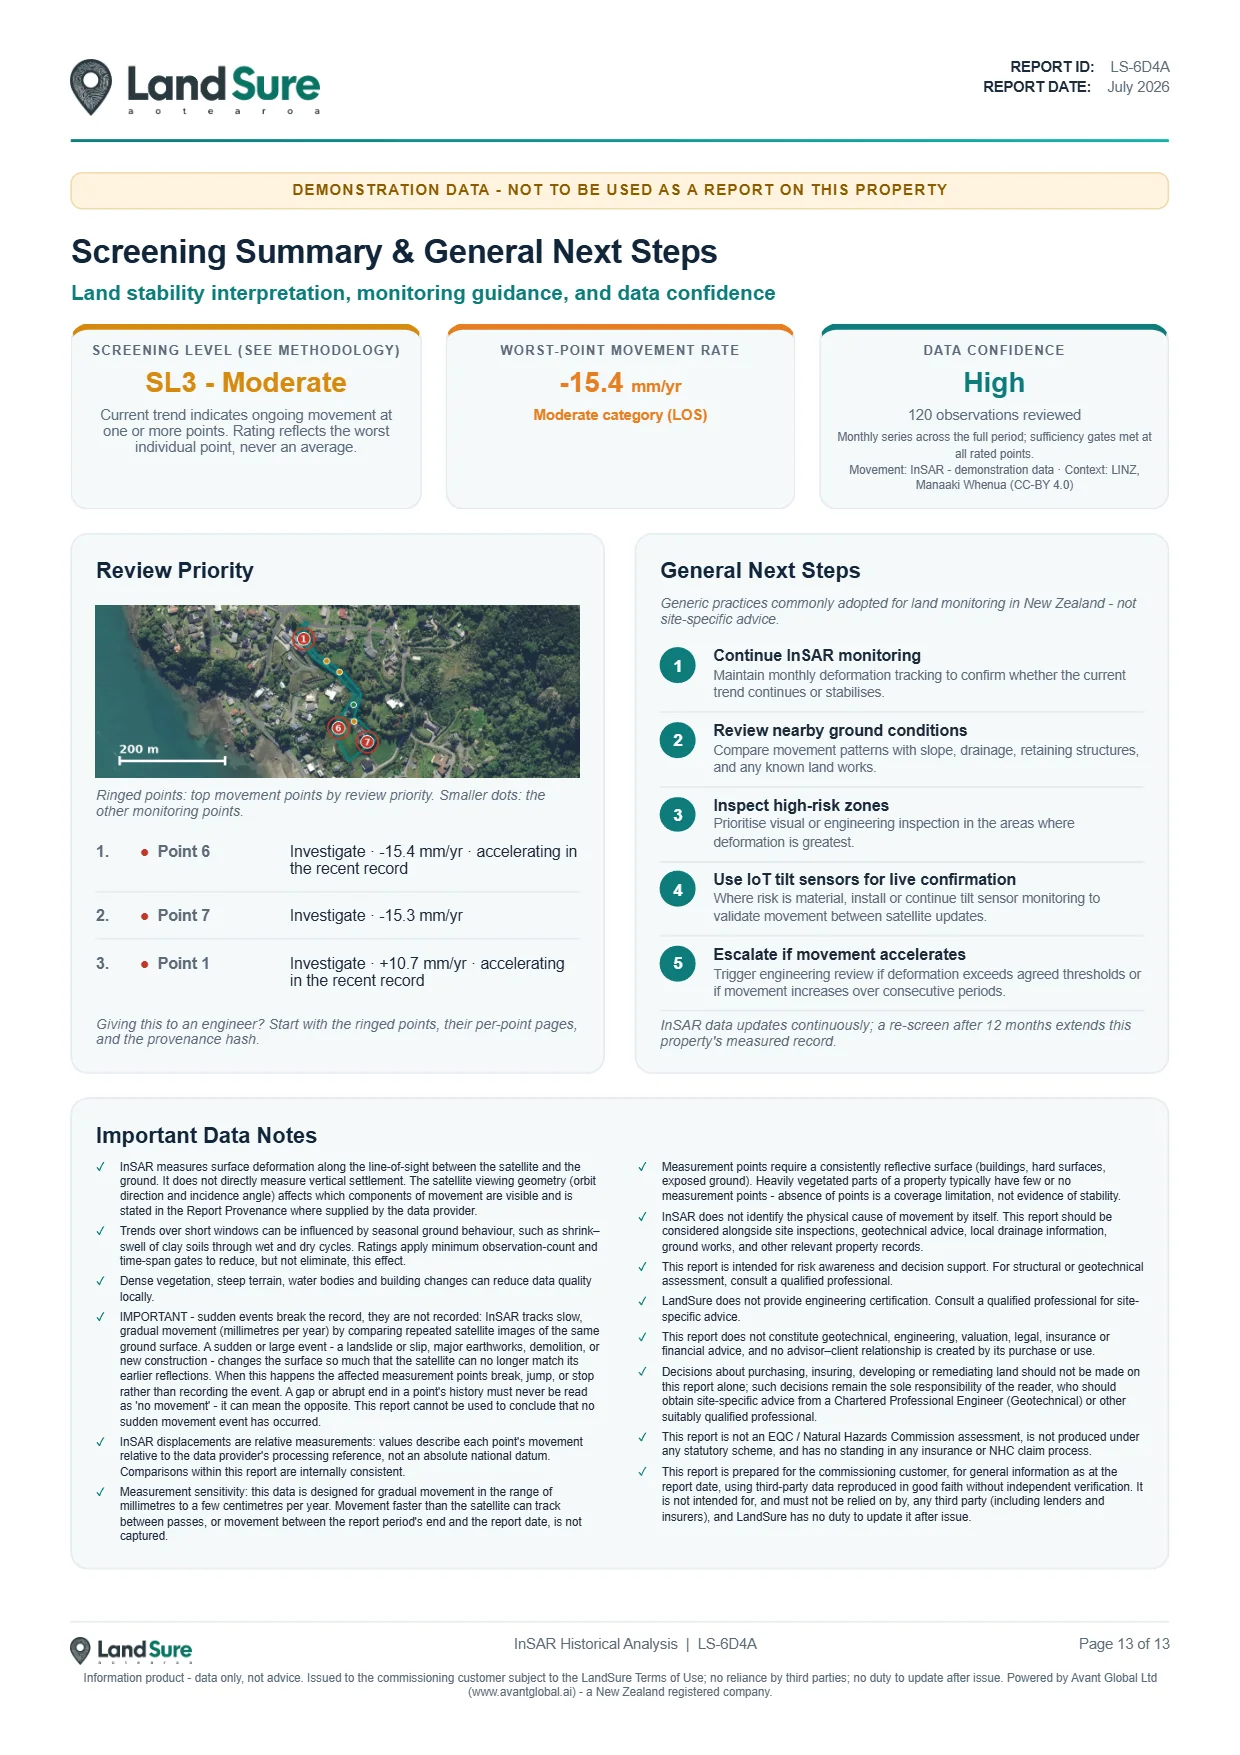
Page 13: Screening summary & next steps - interpretation, monitoring guidance and data confidence.
Why this matters in New Zealand
New Zealand land doesn't stand still. Most of the time, you can't see it moving.
New Zealand sits on the boundary of the Pacific and Australian tectonic plates. The land is compressed, lifted, sheared and stretched continuously - and it doesn't announce itself until something fails.
Heavy rainfall saturating slopes is the leading cause of NZ property damage. Gradual hillside creep often precedes sudden failure by years. InSAR detects the slow movement phase.
The ground beneath a property sinks over time - due to drainage, tree roots, or underlying geology. Foundations crack. Driveways drop. Resale value falls.
Auckland, Wellington, Kaikoura, Napier. Active fault systems can shift suddenly, but typically show measurable surface strain for years beforehand.
Properties near the NZ coastline sit on ground that can creep, slump and settle. Our report measures that ground movement. It does not measure shoreline or cliff-edge retreat - we do not offer coastal erosion reporting yet, so contact us if you need erosion data.
The central North Island bulges and subsides with changes to magma bodies underground. InSAR detected Taupo subsidence covering more than 1,400 km2 - invisible to the eye.
Sources: NIWA, University of Auckland, Insurance Council of NZ, Knowledge Auckland. Current as of 2024.
We'll be straightforward about what this technology can and can't do.
InSAR is not magic. It is a precise measurement tool with real capabilities and real constraints. Here is a straightforward, traffic-light view of where it excels, where it needs care, and where it is not the right tool.
InSAR is great at
- Urban and suburban environments - buildings, roads and structures give excellent radar returns
- Slow movement detection - gradual subsidence, creeping slopes and long-term settlement are exactly what InSAR is built for
- Large-area screening - quickly identifies movement hotspots across whole properties or corridors
- Historical trend analysis - 10+ years of data reveals patterns fieldwork would take years to establish
- Post-event assessment - comparing pre- and post-event movement gives objective dated evidence
- Stable, open terrain - exposed rock, dry ground and paved surfaces return strong signals
InSAR still works, with care
- Dense native vegetation - bush and tree cover scatters the radar signal, reducing reliable points in forested areas
- Steep terrain - very steep slopes change the signal geometry and can create shadow zones behind ridgelines
- Active earthworks or construction - significant surface change between passes can cause signal loss until the surface stabilises
InSAR is not good when
- Movement is very rapid or sudden - the 12-day satellite cycle means a sudden large landslide may not be captured until the next pass
- Standing water is present - flat water returns very little signal, so wetlands or flooded areas may have few or no points
InSAR data does not replace a geotechnical engineer. It gives your geotechnical engineer a 10-year running start.
Where our report indicates movement, elevated risk or uncertainty - we will say so. The "Next Steps" section of every report includes specific referral guidance. We are not in the business of telling people their land is safe when the data suggests otherwise.